This is the second part of the case on the daily rewards wheel at H2Bet. The short case says the wheel went out gradually and was measured against a fair control group. Here I go through how, step by step, including the parts that were less clean than the headline numbers suggest.
Rolling out in waves
I never launched the wheel to everyone at once. A feature that touches bonus money, the support queue and the rewards platform can break in three places at the same time. So the wheel went out in waves, and between each wave someone had to look at the numbers and say go or no go.
The first wave was 5% of players, on July 25. The next day it went to 10%. On August 11 it went to 30%, and from that day I kept a second 30% of players without the wheel on purpose, as a control group. Everyone else was held back for now. Around the middle of September, after the test had been read, the wheel went to 100% of players. Counting from the first foundations document in April, that was about five months from the start of the work to the full rollout.
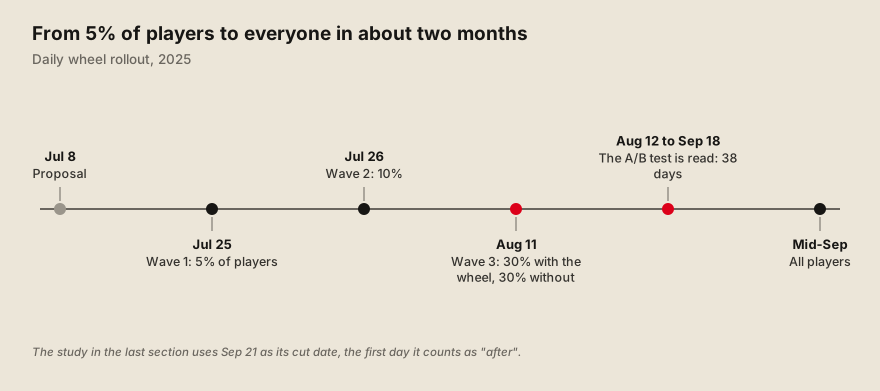 The rollout waves. The first two were a day apart; the third one doubled as the A/B test.
Players were assigned by the last digits of their ID. Every player has a numeric ID. Picking the groups by its ending digits is simple, it is the same every day, and nobody can end up in two groups. The same mechanism lets me say, with no doubt, who was in the group that had the wheel and who was in the group that did not.
The go/no-go between waves rested on four checks. Engagement had to be positive against the control. Technical performance could not get worse. The share of players who claimed their spin had to be above a minimum. And I read the qualitative feedback, from support and from players. In the process document I wrote after this launch, the pattern became three waves of about 15%, 35% and 100% of the base, each one lasting two to three weeks, with a monthly meeting with the sponsors to decide the next wave. The real rollout of the wheel was faster at the start: the first two waves were a day apart.
Waves limit the damage, and they do not catch everything. The overload of the rewards platform came at the full launch, and the bonus that ran out and the support tickets came as the groups grew, all described in the main case. Each of these would have been worse without the earlier waves, and the first one still got through. That is why the go/no-go also asks about technical performance, and why we later started warning the platform before big launches.
The first test, and why I did not trust it
The wave at 30% gave me a real A/B test. One group of 30% had the wheel, another 30% did not, with the same rules, the same season and the same marketing. I read it between August 12 and September 18, 38 days. Because the split was by ID ending, the two groups were comparable from the start.
The early reading was positive. Turnover per player was higher in the group with the wheel, by about 12%. The average deposit ticket was up too, by about 18% (17.7% in the report). Part 3 uses the same two numbers. That was enough to take the wheel to everyone. A clean test says the wheel works for the players who were offered it. It does not say how much it earns once it is part of the product.
After the full rollout, the only comparison left was players against players. Once everyone had the wheel, no control group remained. The natural question then became: how much more do the players who spin deposit than the ones who do not? The answer is always “a lot more”, and it always misleads.
Players who spin were already different before the wheel existed. A player who logs in every day is the one who finds the daily spin. A player who opens the app once a month never does. If I compare the two after launch, I am mostly measuring who they were before. I call it selection bias: the group chose itself. A dashboard that compares spinners with non-spinners will show a big gain for any feature that rewards people who already show up.
I did not want to report a number I could not defend. The wheel costs real money each day. If the gain was inflated, the budget decisions that followed would be built on it. This is also why I kept the A/B result as a first signal and never as the final number.
What a fair comparison looks like
The data team’s answer was to find a twin for each wheel player. For every player who used the wheel, they looked for a similar player who did not. Similar meant: in the same value segment before the wheel, with a similar level of turnover in the last four weeks, a similar number of deposits, similar days active, and a similar number of days since signing up. They built the pairs automatically, and they checked afterwards that the two groups really looked alike on those traits. The technique is called propensity score matching, and it is the only time I will name it. They found a twin for about 90% of the wheel players, which gave the 116,000+ pairs.
Then they compared the change, not the level. Even a good twin will not have exactly the same level as the wheel player. So the question became: how much did each group change between the 14 weeks before the full rollout and the 14 weeks after? The effect of the wheel is the difference between the two changes. If both groups grew with the season and the year-end campaigns, that growth cancels out. What is left belongs to the wheel. The technique is called difference-in-differences.
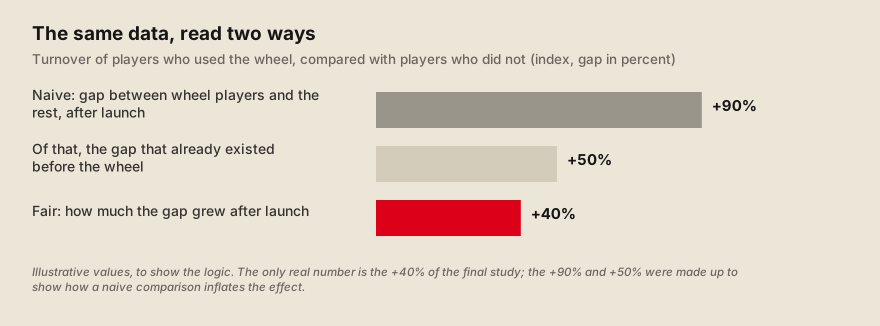 Why the level is not the effect: part of the gap was there before the wheel. Illustrative values.
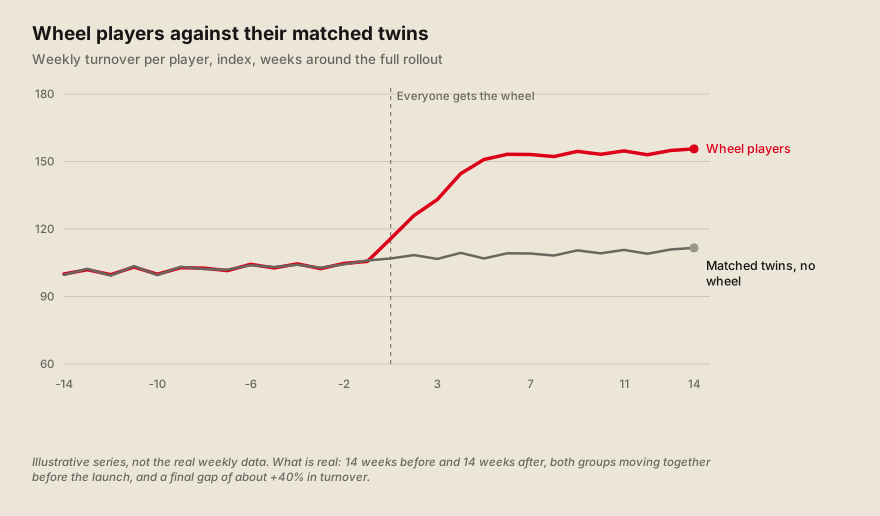 The shape of the fair comparison: the two lines move together before, and the gap opens after.
Two tests were there to catch a trick of the method. This kind of comparison depends on one assumption: if the wheel had never existed, the two groups would have kept moving together. Nobody can see that world. So the team did two checks. The first looked at the weeks before the launch and asked whether the two groups really followed the same trend. They did, and the statistical test was not even close to flagging a difference (a value above 0.93 on all three metrics). The second was a placebo test: they invented a launch date, in May, in a period when nothing had happened, and ran the same comparison. A fair method should find nothing, and it did. The fake effects were -1.3% on stickiness, -3.5% on turnover and +1.0% on deposits, none of them different from zero.
My part was the question, and the data team’s part was the answer. I decided what the study had to answer and read the result next to what I saw in the product. The data team ran it, documented it, and kept the notebook and the list of matched players so someone else can repeat it.
What the study found
The wheel moved the three numbers that matter, and by a lot. Players who used the wheel did 40% more turnover and 39% more deposits than their matched twins, and they were active on a much larger share of the days of the week: stickiness up 55%, which is 8.3 percentage points. Stickiness here is the share of days in a week a player is active, counted among players who deposited on at least two days in the last 28. The ranges are narrow enough to rule out a small effect: the 95% range for turnover goes from +32% to +47%, and for deposits from +34% to +45%.
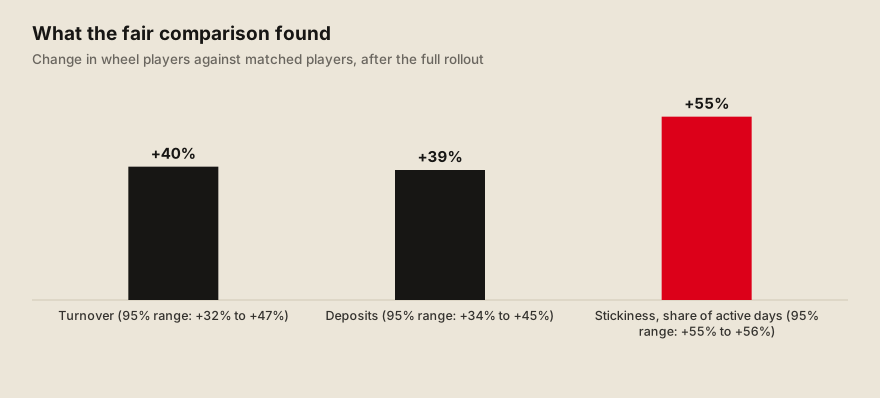 The three headline results of the study, all real numbers.
The return on cost is a range, and I prefer to say it as a range. The study estimates the net revenue the wheel added and divides it by what the wheel cost. The answer depends on which costs go in the denominator, and there is more than one honest choice. Counting only the wheel’s own prizes, the return was between 5.6x and 5.7x, depending on whether I use the costs of the matched group or the global costs spread over it. Adding part of the cost of the Vault, a reward that went live on Black Friday inside the same period, it fell to between 3.9x and 5.0x. Adding all of it, it fell to between 1.7x and 3.6x.
| What is counted as the cost | Costs of the matched group | Global costs, spread |
|---|---|---|
| The wheel only | 5.6x | 5.7x |
| The wheel plus part of the Vault | 5.0x | 3.9x |
| The wheel plus the whole Vault | 3.6x | 1.7x |
Every row is above 1, but the gap between 1.7x and 5.7x is real. I would not quote 5.6x alone, and the short case gives the range for that reason. The honest sentence is that the wheel paid for itself in every scenario we tried, and by how much depends on whether the Vault is charged to the wheel.
More spins meant more effect, and the effect only showed up after the first few. The team split players by how many times they interacted with the wheel. Players with one to four interactions looked just like players with none: no visible gain. The weekly turnover turned positive in the band of 5 to 9 interactions and kept growing with every band above it, up to the players with 100 or more. That is the strongest argument that the wheel itself is the cause, because a hidden difference between the groups would be unlikely to grow in such an orderly way with use.
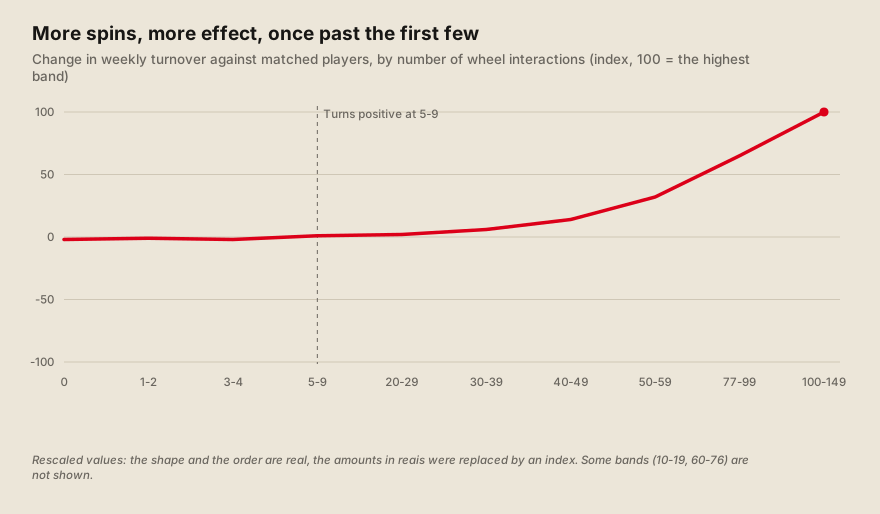 Dose and response: the effect turns positive around 5 to 9 interactions. Rescaled values.
The practical lesson is to help players get past the first five. The wheel does little for a player who tries it twice. The study’s recommendation, which I agree with, is to design the incentives that bring a player from one or two interactions to the inflection point: reminders, progression, something that makes the sixth spin natural.
Players who used the wheel also stayed in the high-value segments more often. The team followed how players moved between the value segments from before the launch to the end of December.
| Starting segment, and where they ended | Wheel players | Matched twins |
|---|---|---|
| Champions who stayed Champions | 48.4% | 38.7% |
| Potential Champions who became Champions | 28.7% | 12.1% |
| High-value players at risk who became Champions | 25.5% | 7.1% |
The twins drifted more toward the risk and inactive segments. This is a result about retention, not only about volume.
What the study could and could not prove
It proved that the effect is not an artifact of who chose to spin. The pairs were balanced, the trends were parallel before, and the placebo found nothing. Together, these make it hard to explain +40% turnover by anything other than the wheel, for the group the study looked at.
It covers about a third of the players who used the wheel. The study only included players who existed before the launch and were active both before and after. They were 37.9% of everyone who interacted with the wheel, and they concentrated 53.9% of the turnover and 42.4% of the wheel’s costs. New players, 31.4% of the base, are not in the study. The effect on them may be similar, and may not. Nobody knows yet.
It is not a randomised test. The A/B split players by ID ending, which works like a random draw. The study has no such draw: players chose to spin, and matching can only balance what we measured. If something we did not measure makes a player both more likely to spin and more likely to grow, the study cannot see it. The placebo and the parallel trends make that unlikely, and do not rule it out. The data team’s own recommendation was a controlled A/B test for new players, to get a direct answer.
It counts a player who spun once as “treated”. That is a generous definition, and it is why the dose analysis matters: the average mixes players who barely tried it with players who live in it.
The financial numbers rest on assumptions. Net revenue comes from the theoretical gross revenue, which uses a margin factor taken from the whole platform in the period and typed into the project as a constant. The costs also depend on which bonuses you count. Both are why I present the return as a range.
The two results do not compare to each other directly. The A/B showed about 12% more turnover for the whole group that was offered the wheel. The study shows 40% for the players who used it. The first includes players who never opened it, so it should be smaller. I would not use either number to promise the other.
Other things were happening in the same weeks. The tier rule changed to turnover in October and the Vault launched in November. The twins lived through the same calendar, so most of this cancels out, but I would not claim that the study isolates the wheel from everything else the product did that quarter.
What I planned next, and did not get to measure
The next question was how much the bonus should be. By then the budget of the wheel was a percentage of each player’s gross revenue to the house, which we called rakeback: 10% for the lower levels and 8% for the higher ones. By then it was paying about half of what it paid in the first A/B. We did not know whether that cut had changed behavior, and we did not know where the extra money stopped paying off. The study proved that the wheel works. It could not say if the amount was right.
So in December 2025 I wrote the design of a bonus elasticity test. Elasticity here means: if the bonus moves by some amount, how much does behavior move? The test lasted 30 days. For the lower levels, 10% of players stayed outside as a holdout, 30% got half the current bonus, 30% kept the current one and 30% got 50% more. For the high-value players, the group was too small for four arms, so it was split in two: 4% against 12%. The split would again be by the last digit of the ID. The cost was designed to cancel out, since the groups with more and with less bonus offset each other.
Its main measure was stickiness and turnover per player, plus how much was deposited for each unit of bonus given. I defined a minimum effect we wanted to detect, 5%, and with the size of each level that was feasible for all of them, except the high-value group. There the minimum detectable effect was about 22%, so only a big difference would show. I put the limit in writing. I also wrote the kill switch: churn above 10%, a drop of more than 20% in the revenue estimate, or complaints from support, mainly from high-value players, would stop the test.
I did not measure it before I left. The design was ready and went to the people who had to approve it. I found no result in the material I kept, and I did not see it run. Anything I said about what the bonus curve looks like would be a guess, so I will not make one. What I can say is the question we wanted answered: is there a point after which another real of bonus stops bringing in more than a real?
What I would do differently is ask for the test earlier. The first A/B had two groups of 30% and ran for 38 days. After it, we reduced the bonus and nobody was measuring the effect of the reduction. A holdout that never gets the bonus, or a standing test of a few points up and down, would have answered this question while the first A/B was still fresh.